

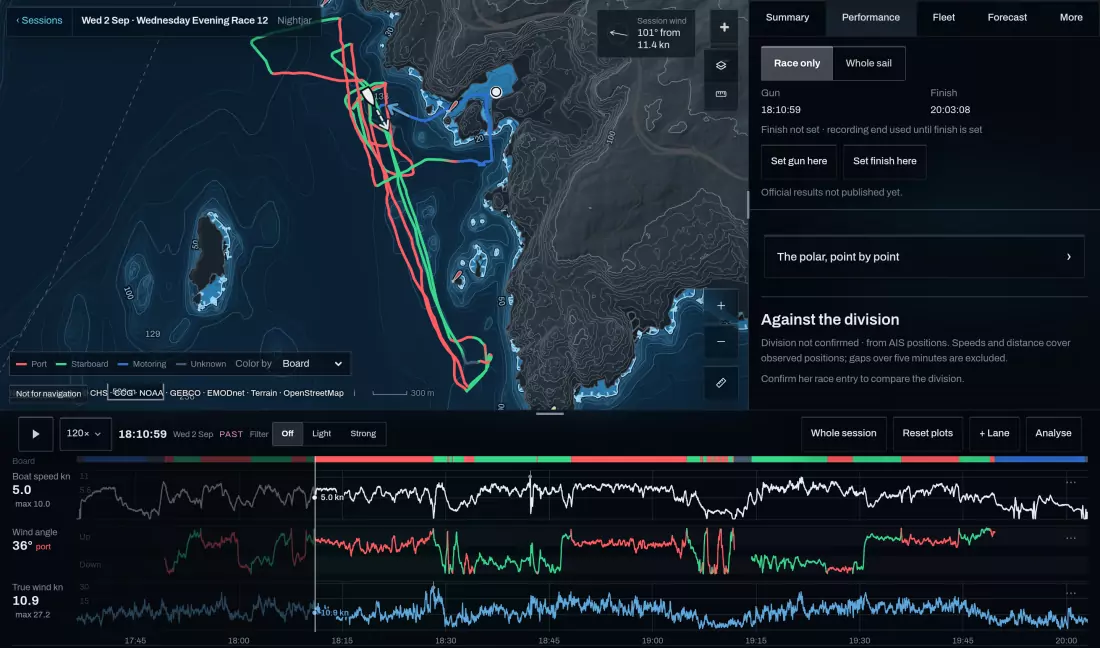
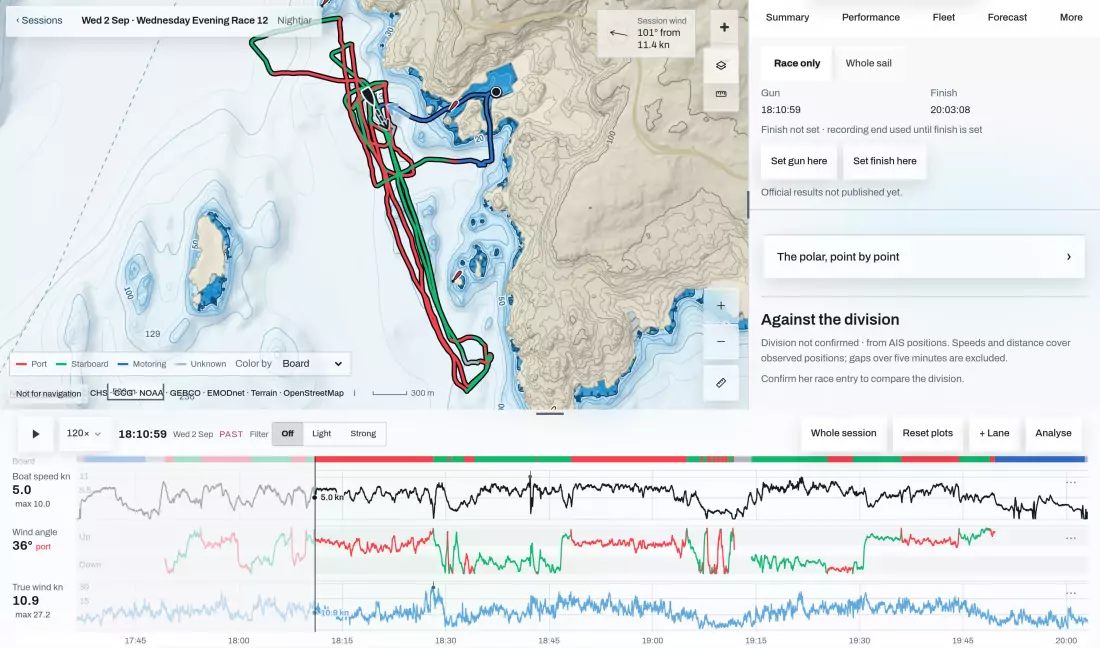
The answer first
One sentence on where the time went, then the stretches that cost it.
Most sailing data ends up as lanes nobody has time to read. Telltale reads them first: the Performance tab says in one line where the boat was closest to its polar and where it lost the most minutes, then lists the stretches that cost the most, with their times. That is a coach’s job at the debrief: find the moments that mattered and start there.
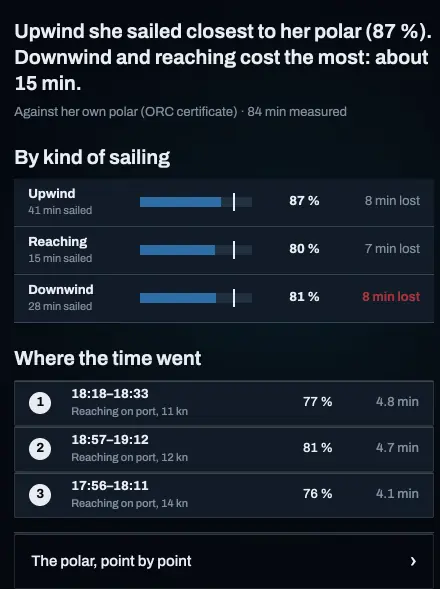
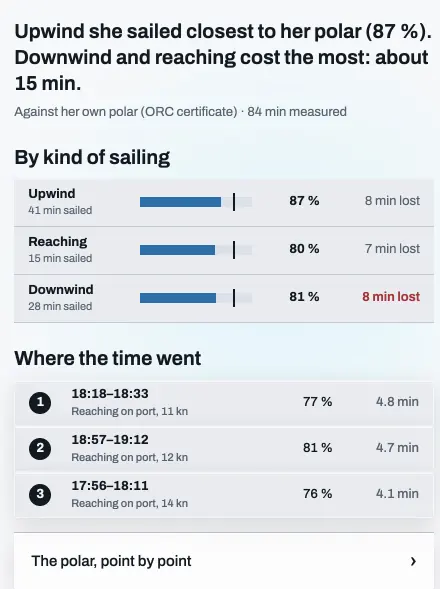
Every stretch against your polar
Boat speed against the polar’s target for the wind and angle at that moment.
With boat speed through the water and true wind, each moment is compared with the target from the boat’s polar, so a light patch is not mistaken for poor trim. The sail is split into upwind, reaching and downwind with the minutes lost on each. A polar can be the designer’s, your own, or an ORC certificate’s, whose speeds come from the ORC velocity prediction program.
With GPS alone there is no speed through the water, so you get the track, speed over ground, the tacks and gybes, and the fleet, but not percent of polar.
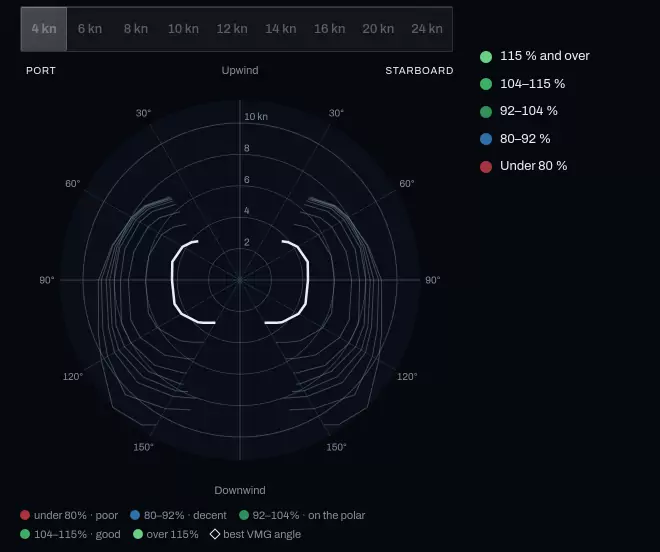
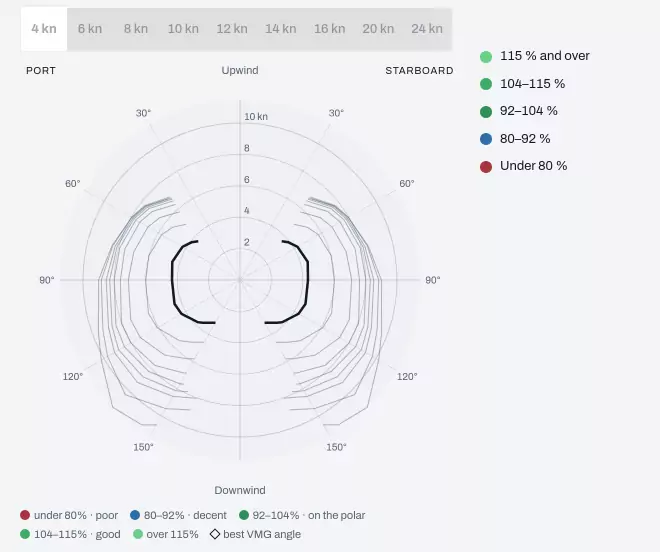
Reading the Performance tab · What the words on a polar mean
References 1
A coach’s analysis of the whole race
Starts, mark roundings, beats and manoeuvres, boat by boat, from the tracker.
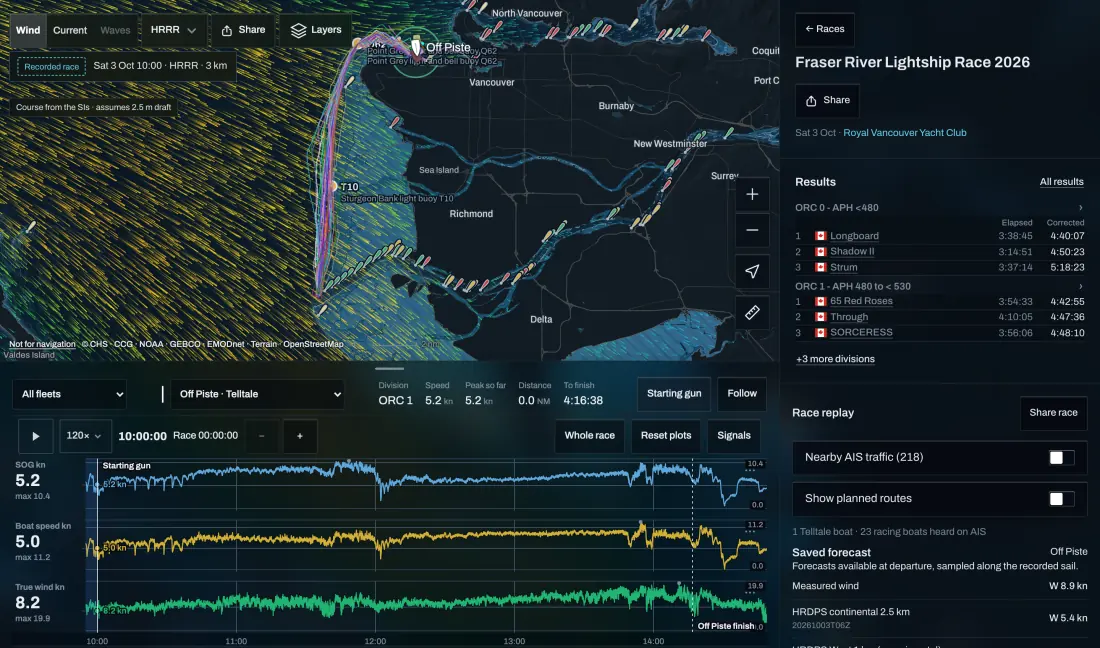
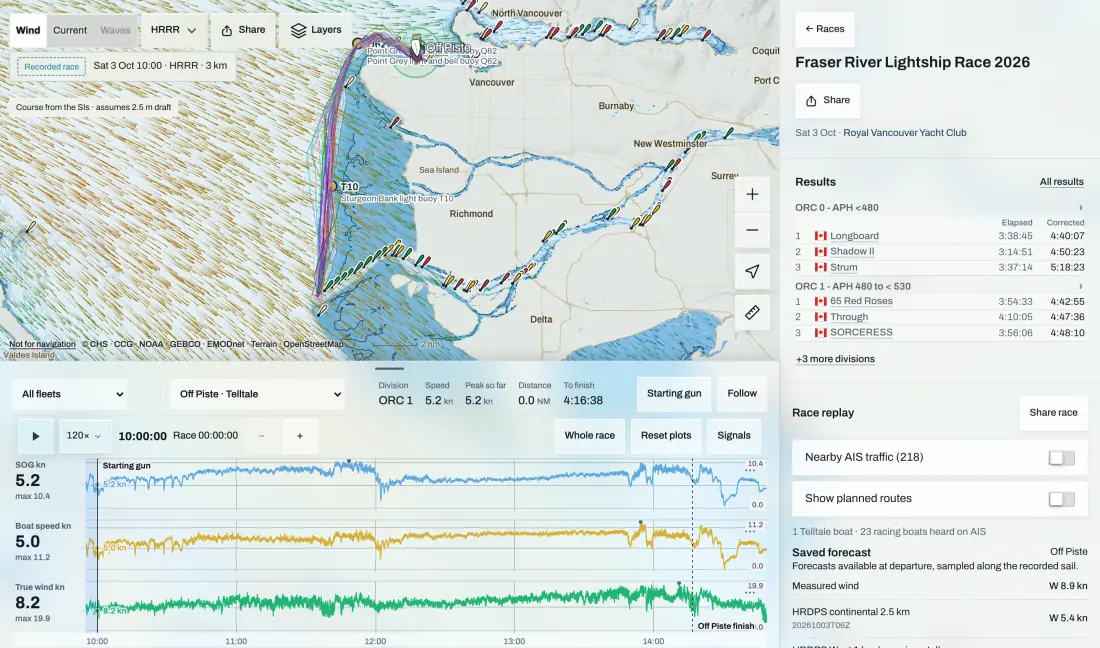
When a regatta is tracked, its race page gets an analysis: who started best, how far from the line and how fast at the gun, each boat’s place at every mark and where it was gained or lost, and the legs and manoeuvres against the fleet. Pick any boat to read the race from its side. It is worked out from the tracker data and, while it is in preview, open to signed-in sailors.
2026 J/70 North American Championship: results, replay and analysis · Read the J/70 North Americans analysis · How the J/70 North Americans were won · Rolex Middle Sea Race analysis
Against the fleet, from your own AIS
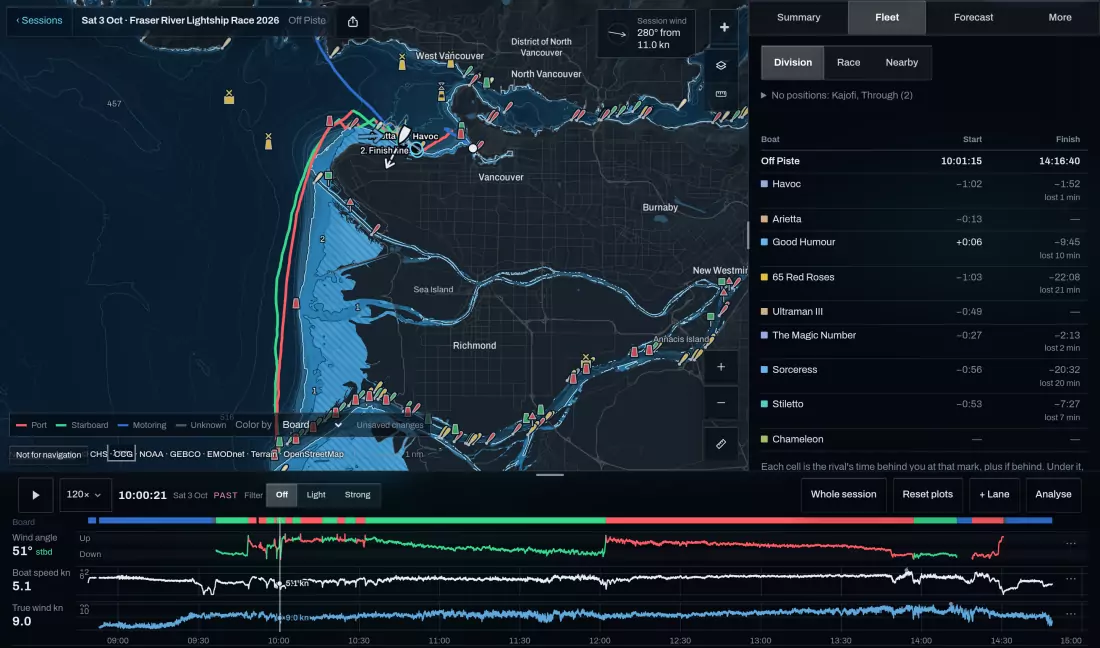
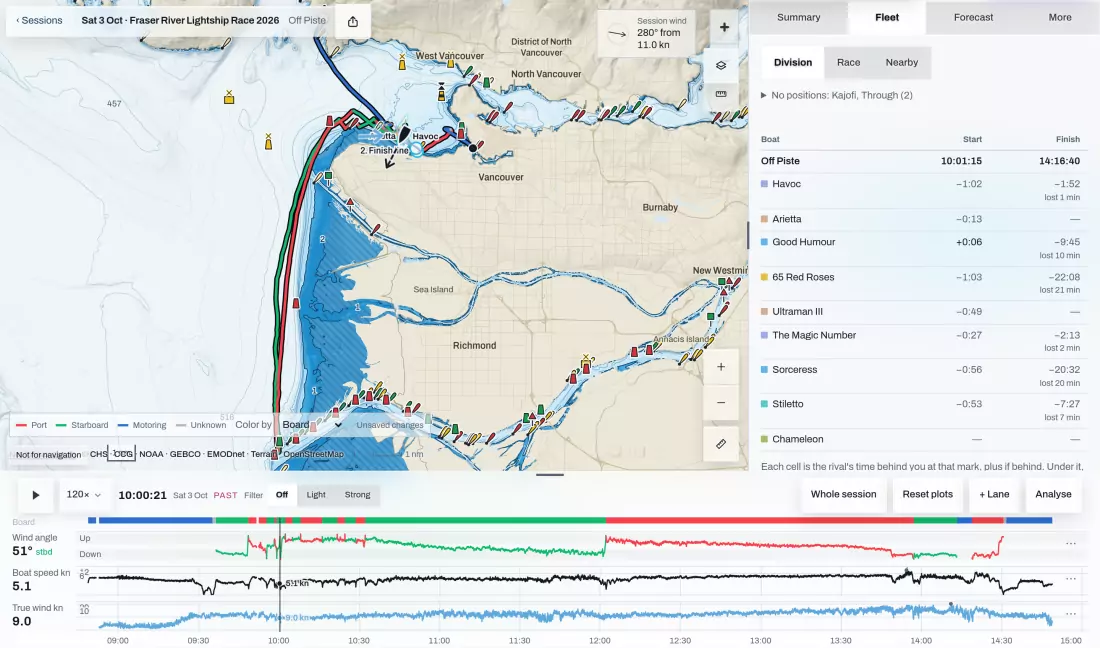
No trackers handed out: every boat your AIS hears is in your debrief.
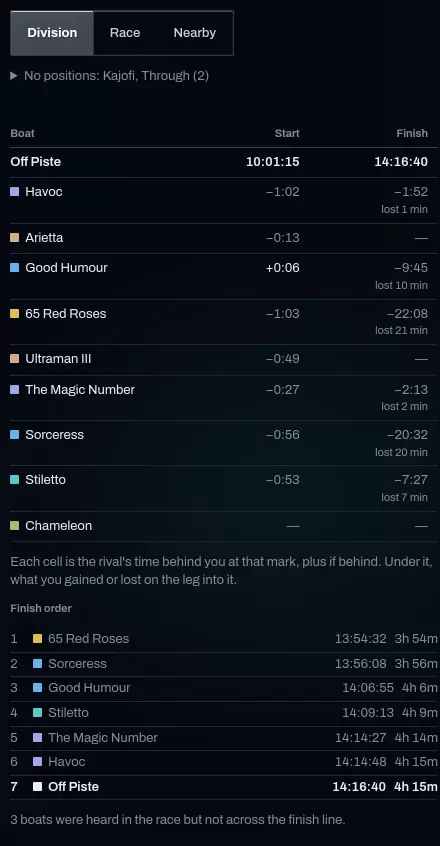
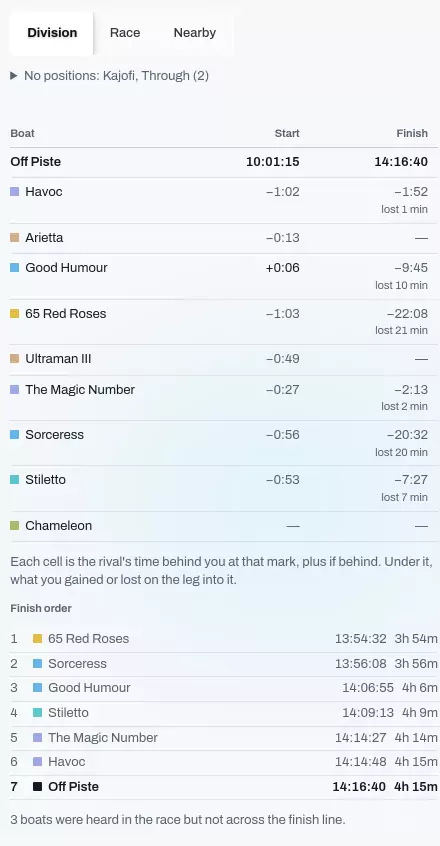
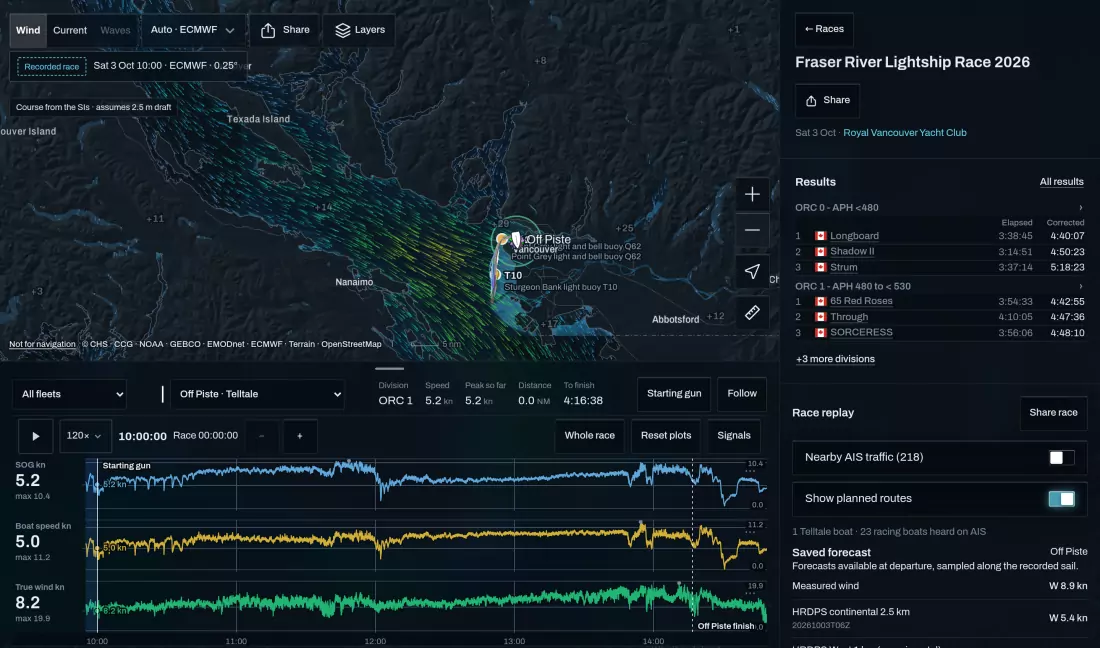
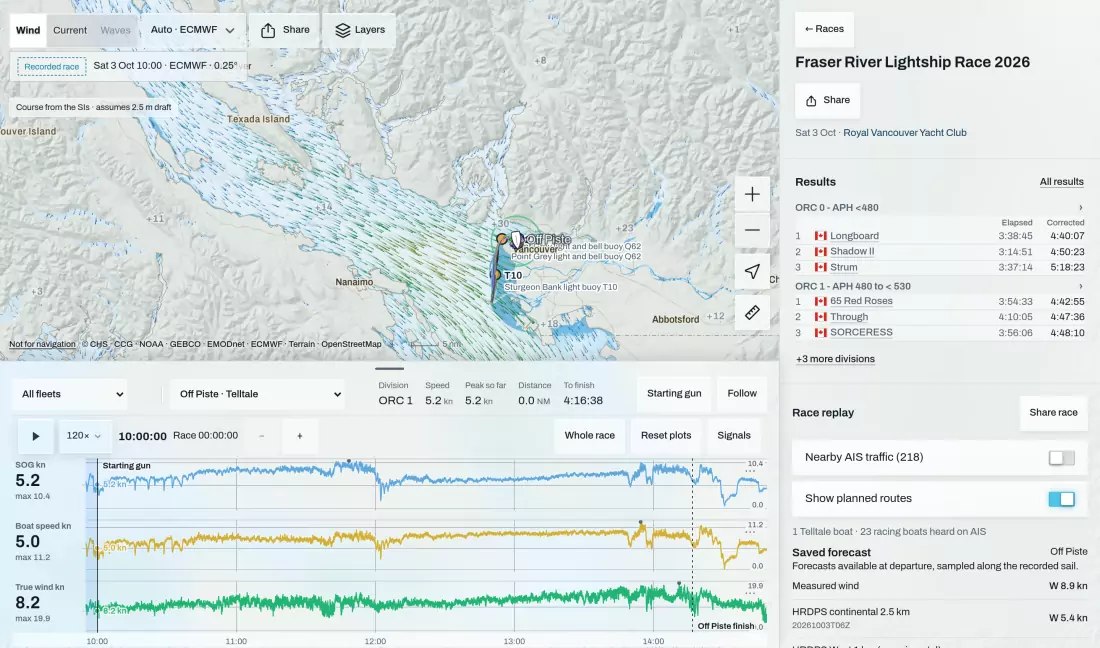
Record with Telltale and the boats your AIS receiver or transponder hears are recorded too. The session’s Fleet tab sets your time against each rival at the start and every mark, with what was gained or lost on the leg into it, and the race page replays them all together. Boats whose recordings are linked to the race appear too, with or without AIS.
Which forecast was right
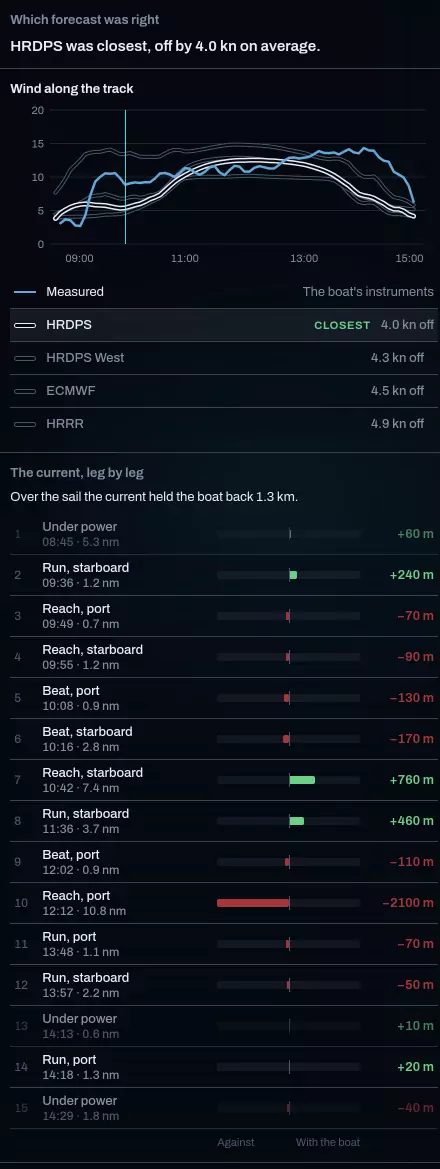
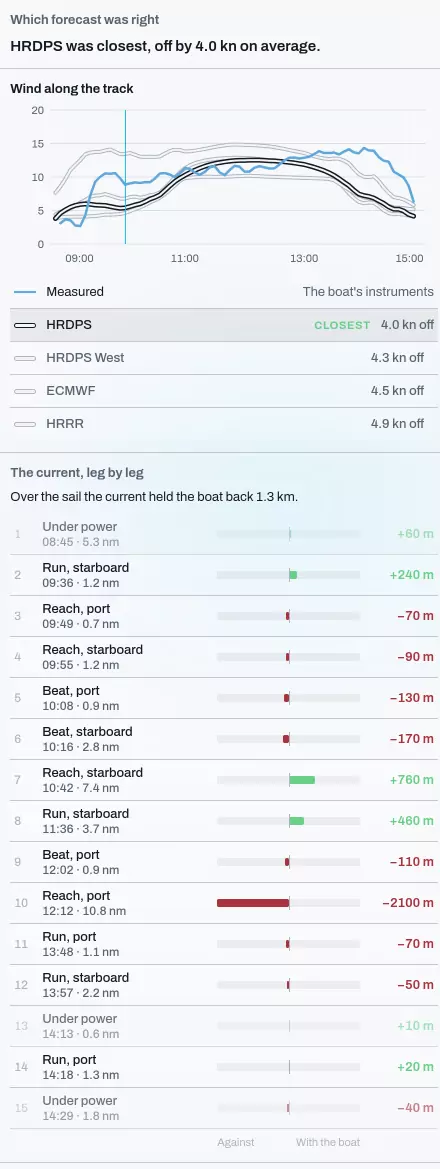
Each model’s wind along your track, against what you measured.
The Forecast tab samples every model along the track at the time you were there and says which came closest and by how much, then shows the current leg by leg. Next time you sail that water, you know which model to lean on. The models compared are HRDPS, HRDPS West, HRRR and ECMWF IFS.
How forecasts are corrected · Weather models explained
References 2
Where a language model helps: the sailing instructions
Fixed rules write the race brief; a language model reads the marks for your course pack.
A race page’s brief is read from the notice of race and sailing instructions by fixed rules, each line linked to its clause. In a boat’s Courses tab, a Pro feature, a language model reads the SIs into a course pack. It gets no tools; every mark it reads is checked in code, shown with the sentence it came from and confirmed by the crew before a course becomes the boat’s plan.
References 3
Coach mode for squads and programmes
The debrief deck, the RIB pad and a one-page report per boat.
Pick a race and your boats, and coach mode builds the debrief: where the finishing order was set, the line and which end was favoured, then the start and each leg played back with the whole fleet. On the water, sailors join from their phones with a QR code, the coach taps the line, the marks and the gun from the RIB, and each boat gets a one-page report for each piece, with three things to work on.
Measured, then explained
Every number comes from a reading; the analysis never fills a gap.
The debrief is arithmetic on what was recorded: positions, boat speed, wind and the polar. Where an instrument drops out, its lane shows the gap rather than a guess, and a boat seen only on AIS gets no instrument figures. That is what lets a crew trust the stretch it is told to look at.
Calibrate boat speed first: a log that reads low makes every stretch look slow. The analysis points at the moments; what the crew saw then is still the coach’s question.
Other tools in this space
Different tools answer different questions. Many crews use more than one.
Data is a tool for the debrief, not the whole game, as Sailing Team Germany’s research lead put it about SAP’s analytics.
| Tool | What it does | What it needs |
|---|---|---|
| Telltale | Debriefs every sail and race: polar, fleet, forecast, starts and marks | A phone, a laptop or a boat computer; AIS or a race tracker for the fleet |
| PredictWind AI Polars | Learns a boat’s polar from its logged sailing, for routing | A PredictWind DataHub on the boat’s NMEA 2000 network |
| SAP Sailing Analytics | Tack-by-tack analytics for tracked regattas | An event that runs it |
Sources and review
Official references checked on 2026-11-14. Product details and schedules change; the provider’s page is the current word.
- Offshore Racing Congress: ratings and the ORC velocity prediction program
- ECMWF: operational AIFS and IFS
- World Sailing: Racing Rules of Sailing
- PredictWind: AI Polars
- PredictWind help: DataHub automatic polar generation
- SAP Sailing Analytics
- Sailing World: Where data meets development (SAP and Sailing Team Germany)
- Telltale: recording options