

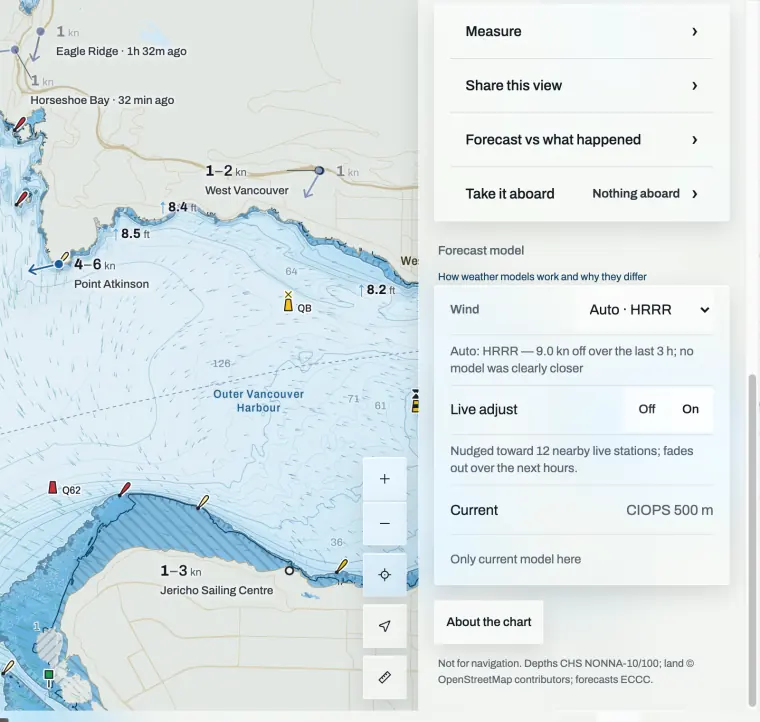
Why a forecast drifts
A run is hours old by the time you read it, and a 2.5 km grid smooths over headlands and gaps.
Each model starts from the weather as it stood when the run began, and the run reaches you hours later. HRDPS works on a 2.5 km grid, so one value covers a headland, its lee and the water off it. A station measures what is blowing now, at one spot.
References 2
What gets measured
Marine and coastal stations and buoys, including Jericho Sailing Centre. Harbour and inland sites are left out, and so are boats.
Telltale uses fixed stations on the shore and moored buoys, and brings each reading to the standard 10 m height before comparing it with the model. A buoy or a marine station counts in full and a coastal one a little over half. A harbour or inland station reads the shelter around it, so it gets no weight. Readings from boats, yours included, are never used.
The correction is worked out against the model you are reading, and the map, a tapped spot and its table all apply it the same way.
References 1
How far a reading reaches
Strongest near the station and fading with distance; nothing beyond 90 km. Near a buoy, that buoy decides.
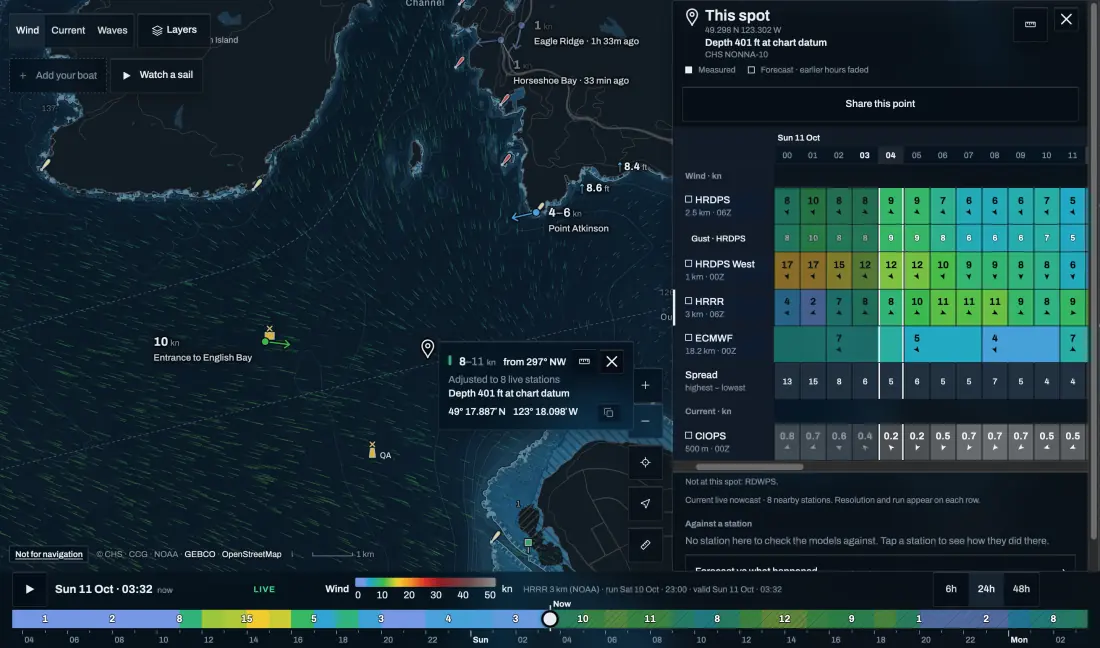
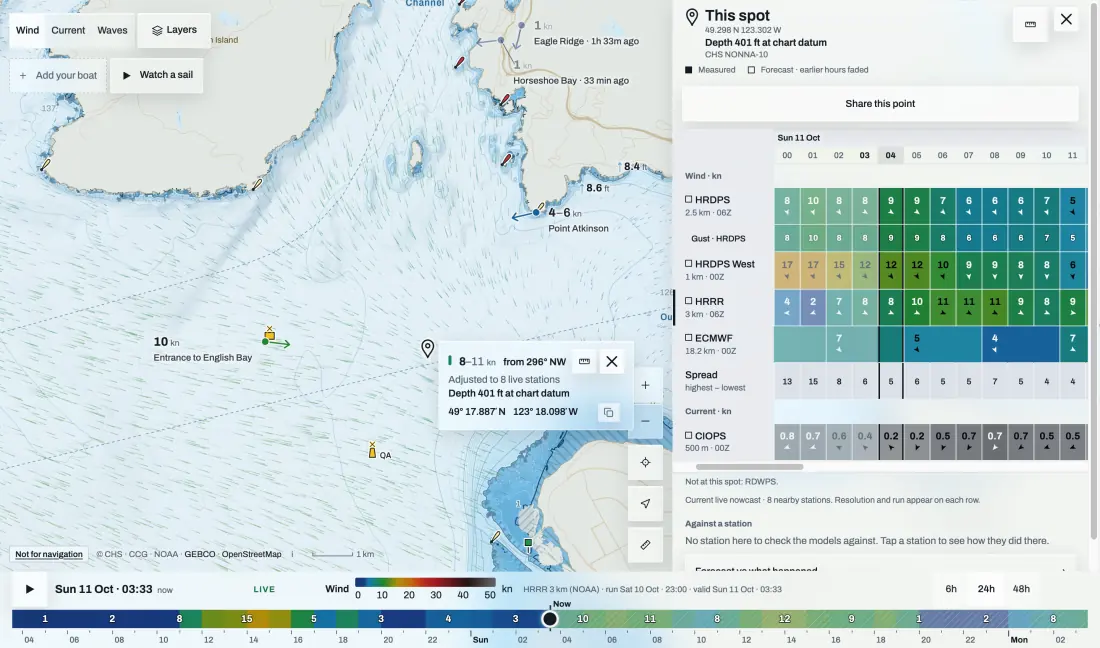
For each station, Telltale takes the difference between what it measured and what the model had for that hour, speed and direction together. Right beside a lone station the forecast moves up to 80 % of the way toward it; the weight falls away over about 30 km and stops at 90 km. Within about 9 km of a buoy, the buoy’s own correction applies. Shore stations that face the same open water add a local correction of their own.
In Howe Sound, English Bay and the approaches from the Strait, Telltale also models the cool marine air flowing around the steep shores, refitted to the stations every 15 minutes, and blends it in close to high ground. It is new and still being checked, and Live adjust turns it off with the rest.
How long it lasts
About a third of the correction is left after 3 hours, and none after 9.
The correction fades with time away from the reading: after 3 hours about 37 % of it is left, and from 9 hours on the forecast is the model’s own again. For this afternoon, check the stations again before you leave.
Readings it ignores
Anything over 75 minutes old, or too far from the model to be believable.
A reading more than 75 minutes old is left out. So is wind over 40 m/s, or more than 12 m/s (about 23 kn) away from the model at that hour. A station that stops reporting stops correcting.
The best model here
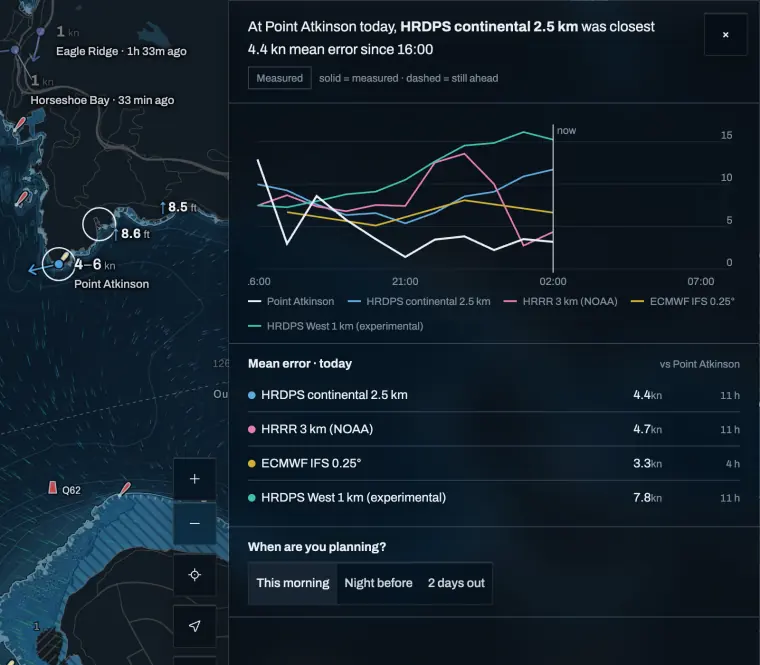
Each model is scored against what the stations measured. Forecast vs what happened shows the record.
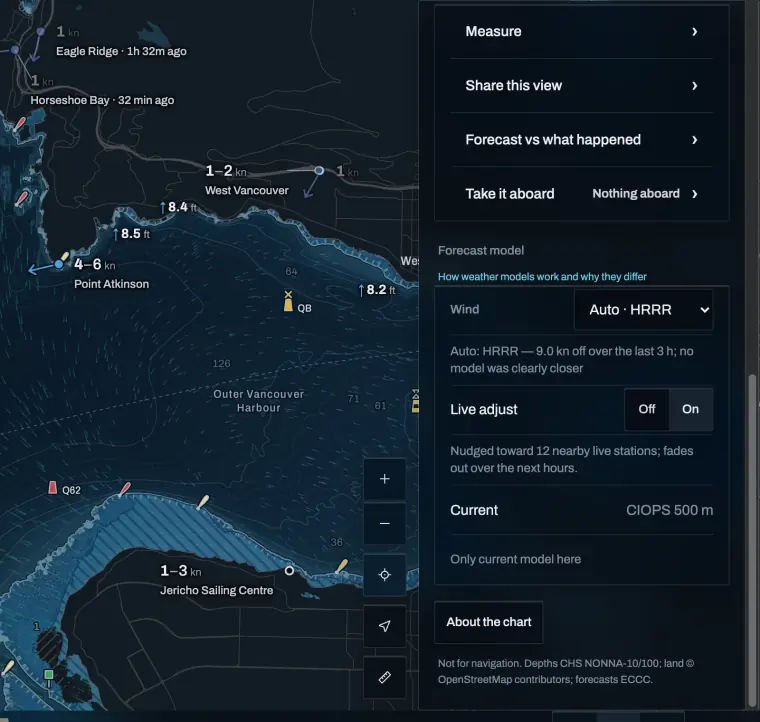
On the map, Auto picks the model whose wind, speed and direction together, has matched the water stations around your view best over the last 3 hours, or 6 when 3 are too few to judge. That model is marked Best. A challenger within 10 % of it is a tie, and the current pick keeps it, so the map does not swap models on noise.
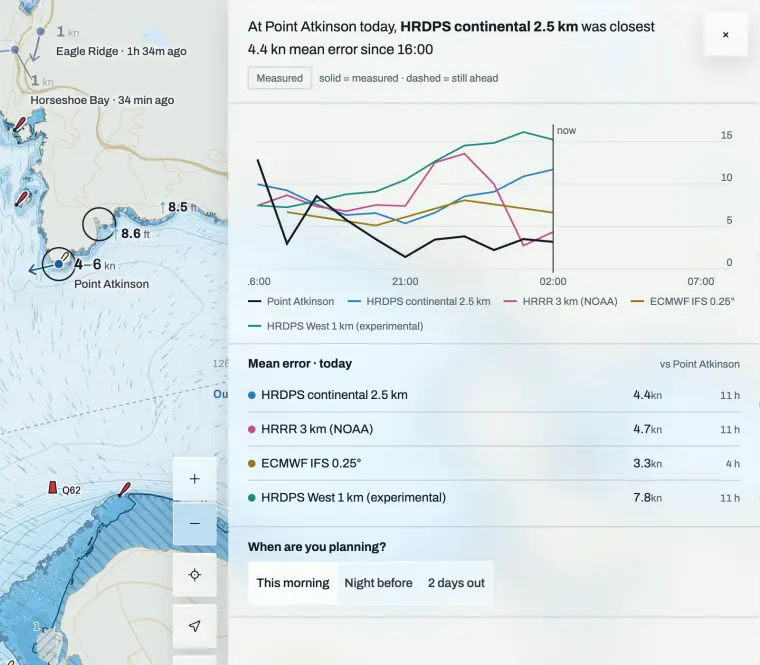
A station’s panel names the model that was best there over the last 24 hours. Forecast vs what happened lines up each model’s wind with what the station measured today and names the closest, with its mean error.
References 1
Adjusted or original
Switch between them at any time. Models agreeing is not a probability.
Live adjust, under Map layers, is on unless you turn it off for this visit: Telltale adjusted, nudged toward the nearby stations. Off shows each model’s original forecast as its provider published it. A tapped spot says which one you are reading.
When the models agree, the forecast is more settled, but their agreement is not a calibrated chance of being right.
Sources and review
Official references checked on 2026-10-11. Product details and schedules change; the provider’s page is the current word.